Operations Console
A working simulation of the dashboard and automation layer I build for owner-led businesses. Switch the rules on and watch the work clear.
The idea
Most owner-led businesses lose their week to the same quiet tasks: routing requests, approving small quotes, booking slots, chasing invoices. None of it is difficult, all of it is constant, and it is almost impossible to see how much it costs until it is made visible.
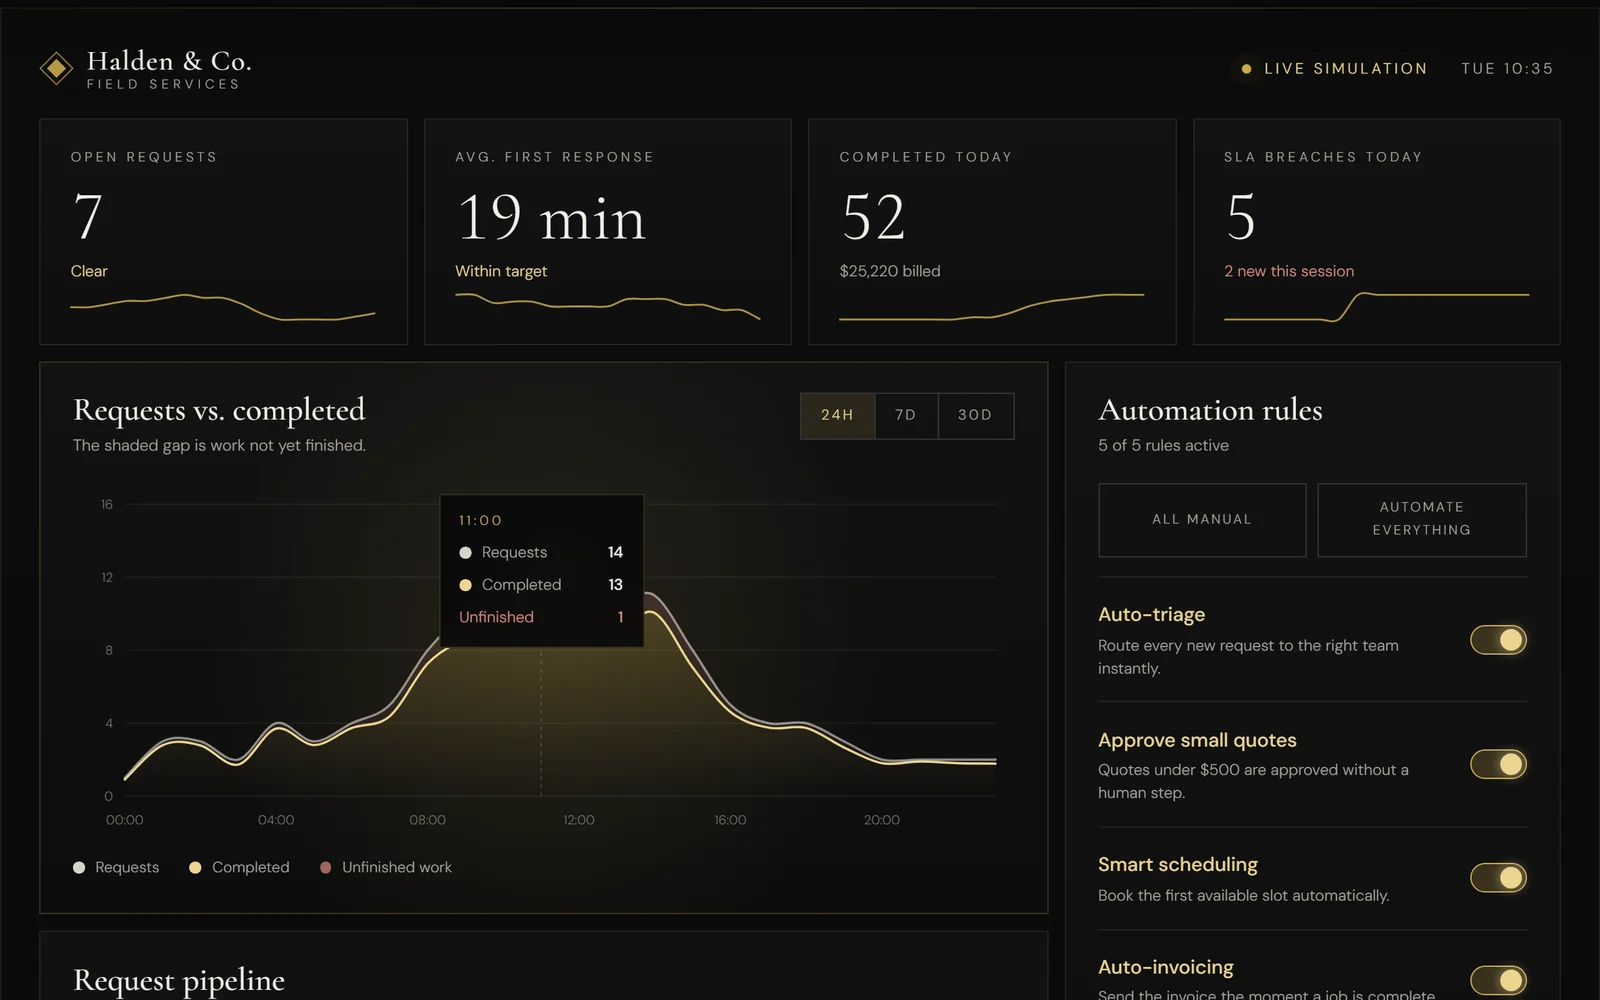
This demo makes it visible. It simulates a small field-services company receiving a steady stream of requests, and puts a console in front of it: live numbers, a request pipeline, a feed of everything that happens, and five automation rules you can switch on and off.
What to try
- Leave everything manual and watch the backlog build. The queue grows, first-response time drifts past its target, and service-level breaches start to appear.
- Press “Automate everything” and watch the same workload flow through. Open requests fall, response time collapses, and the gap on the chart closes.
- Toggle one rule at a time to see exactly what each is worth. Every rule carries a time cost, so the staff hours returned each week update as you go.
- Hover the chart for a reading at any point, and switch between 24 hours, 7 days and 30 days.
How it is built
Everything on the page is written from scratch in TypeScript, with no charting or UI libraries. The chart is hand-drawn SVG with smoothed curves, the cards are moved between columns with the Web Animations API, and the numbers ease toward their targets rather than jumping. The simulation pauses when you scroll away or switch tabs, and it respects the reduced-motion setting.
What it demonstrates
- Dashboards that earn their place. Each figure is there because someone would act on it.
- Automation with a number attached. The model behind the hours saved is deliberately simple and openly labelled as illustrative. In a real engagement, the Blueprint phase replaces those assumptions with your actual volumes.
- Interface craft. Dense information, calm presentation, and motion used only where it explains something.
About the data
The company, the clients and every figure are invented. Nothing here is drawn from a real organisation, and the code was written specifically for this site.